12 Essential Marketing Analytics Tools for 2024 (Free & Paid)
12 Essential Marketing Analytics Tools for 2024 (Free & Paid)
By Mateusz Makosiewicz✓ Reviewed by Ryan Law
Updated: November 9, 202316 min read
Marketing analytics tools give you access to data you can use to track your performance and find ways to improve. If you’re in digital marketing, chances are you’re going to need more than one analytics tool.
In this guide, we’ll go through twelve tools that will help you identify your best-performing tactics, and content, enabling you to do more of what works.
1. Google Analytics 4
Google Analytics 4 (GA4) comes with almost everything you need to see how many people visit your website, where they come from, and what pages they visit.
Key use cases
- Track results of specific campaigns using the UTM tags.
- Measure conversions on important pages such as form completions or transactions.
- Use the Explorations tool to uncover trends and patterns in user behavior.
Highlighted feature: Explorations
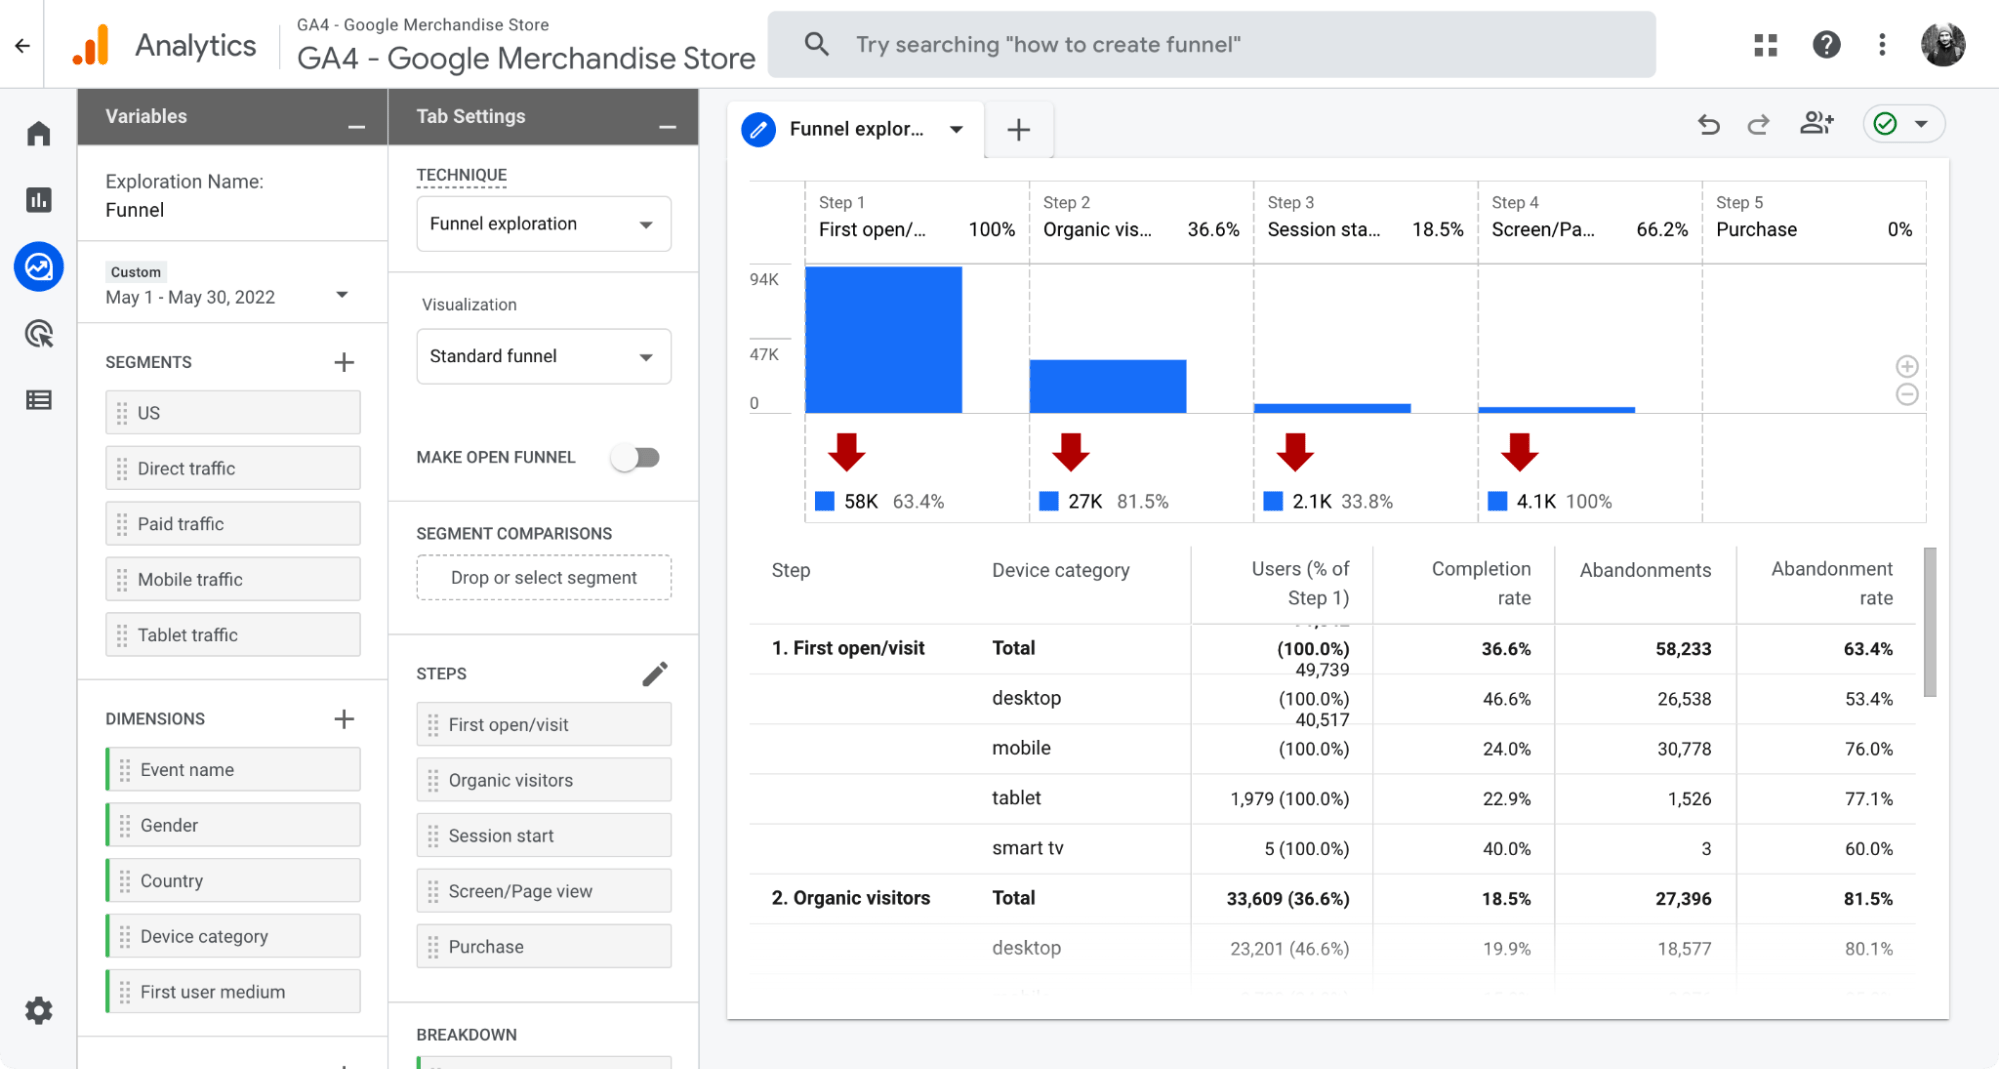
The Explorations tool is like your own research lab for web analytics.
It allows you to create custom reports that go beyond the information provided by GA4’s standard reports. So if there’s a question bugging you and standard reports don’t cut it, you will likely find your answer in Explorations.
You can then share your reports with other people or export them.
Here’s an example of a funnel report. Google has revamped funnels in its GA4. It tracks everything as events now, so most of the time, you won’t need to create custom events to create funnels.
What’s more, you can create open funnels (the user can enter at any point) and closed funnels (the user can only enter in the first step). Closed funnels are the default option, but you can change it to track non-linear user paths.
Pricing
Free.
There’s also a premium, paid version as part of the Google Marketing Platform (basically, a solution for enterprises).
FURTHER READING2. Ahrefs
Ahrefs is an all-in-one SEO toolset. It’s the kind of tool you absolutely need if you want more visibility into your performance on Google.
Key use cases
- Audit your site and fix SEO issues that hold you back.
- Do an SEO competitor analysis to fill content gaps, see your competitor’s top content, and discover where and how they get backlinks.
- Monitor your ranking performance on Google to know whether your SEO tactics are working.
Highlighted feature: Opportunities
A great way to start with Ahefs is the Opportunities report. It’s a report consisting of the top opportunities the tool identifies after analyzing your site.
It’s a bit like hiring an SEO consultant to show you where to start with search engine optimization.
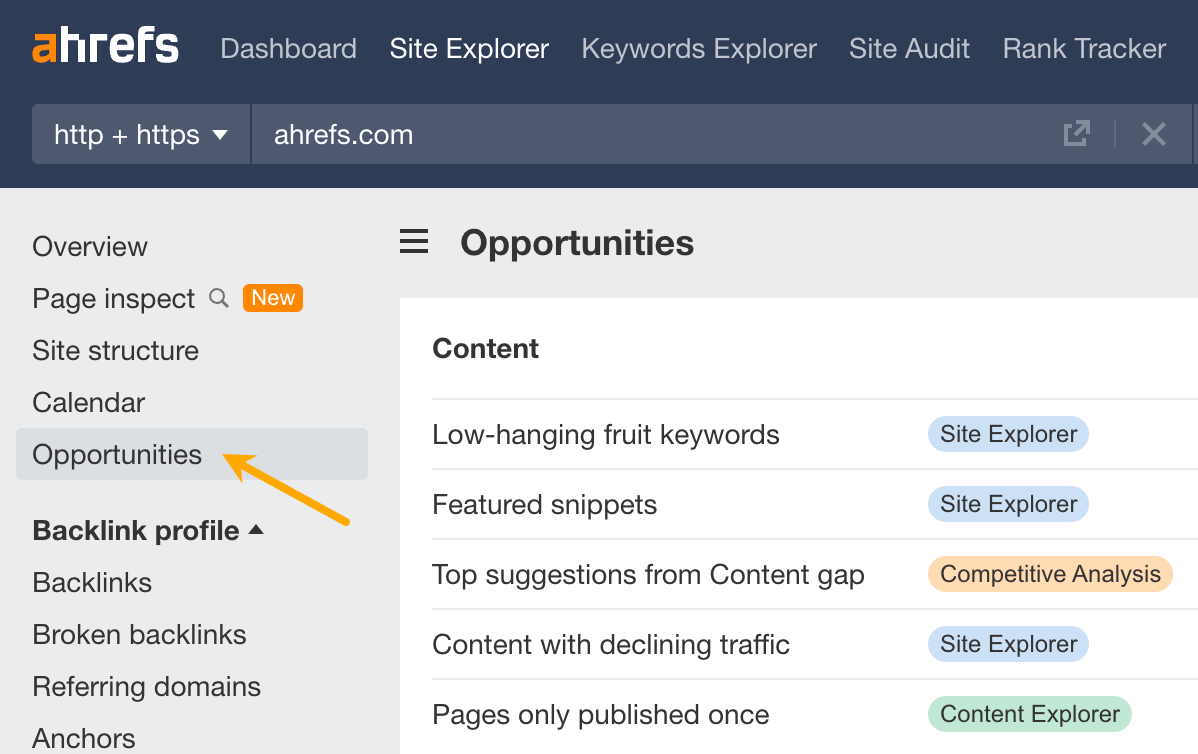
You’ll find three categories of opportunities here. They reflect three key areas you need to cover to increase visibility on Google:
- Content: this section is all about keyword analysis. You can see keywords that are relatively easy to improve on, keywords that your competitor ranks for but you don’t, pages that have declined in traffic in the last six months, and more.
- Links: focuses on link analysis. You can discover new internal links you should build, unlinked brand mentions, pages that link to your competitors but not to you, and more.
- Technical: a technical SEO analysis ready to take action on. You’ll discover critical SEO issues that could undermine your visibility on Google.
Pricing
Ahrefs offers quite a collection of free SEO tools. You should definitely check out Ahrefs Webmaster Tools: It uncovers all of your organic keywords and backlinks and monitors your website’s SEO health for free. Plus, you can use it for all of the websites you own.
If you want to get the most out of SEO, check out our premium plans, starting from $99/mo (or $83/mo if you pay annually).
FURTHER READING3. Google Search Console
Google Search Console (GSC) is a tool that helps you monitor and troubleshoot your website’s appearance in Google’s search results.
It’s one of the essential tools for SEO because it’s the only one that features search performance data straight from Google (although limited). Marketers use it to learn the exact amount of organic traffic they’re getting from that search engine.
Key use cases
- See the traffic you get from Google’s web, image, video, news results, and Google Discover.
- Use the CTR metric to see how page title optimizations contribute to clicks.
- See if Google indexes your site without issues.
Highlighted feature: Click-through rate
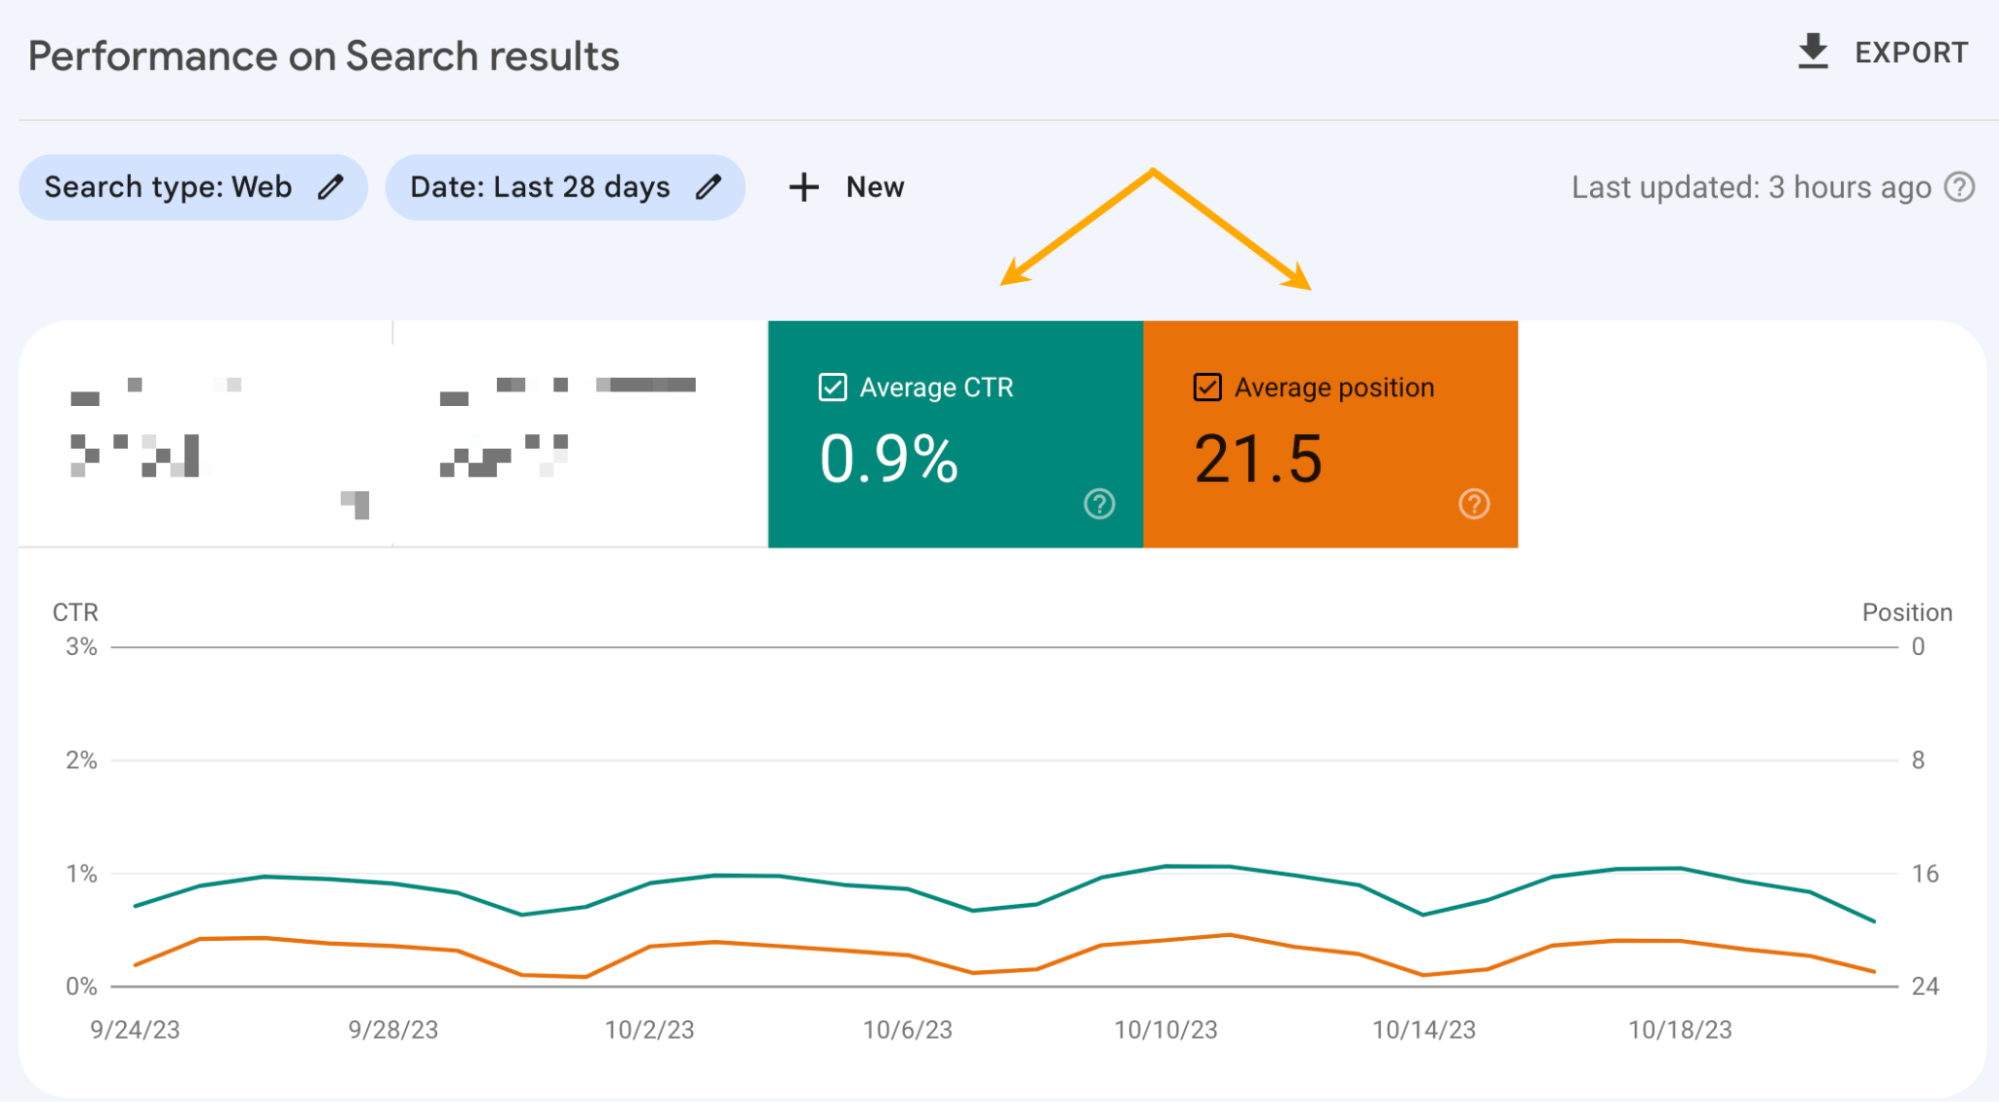
With GSC, it is quite easy to spot pages that rank high but don’t get as many clicks as you expect.
GSC has a handy metric for this: CTR (click-through rate). You can find it in the Performance tab; just make sure to tick the “Average CTR” and “Average position” first.
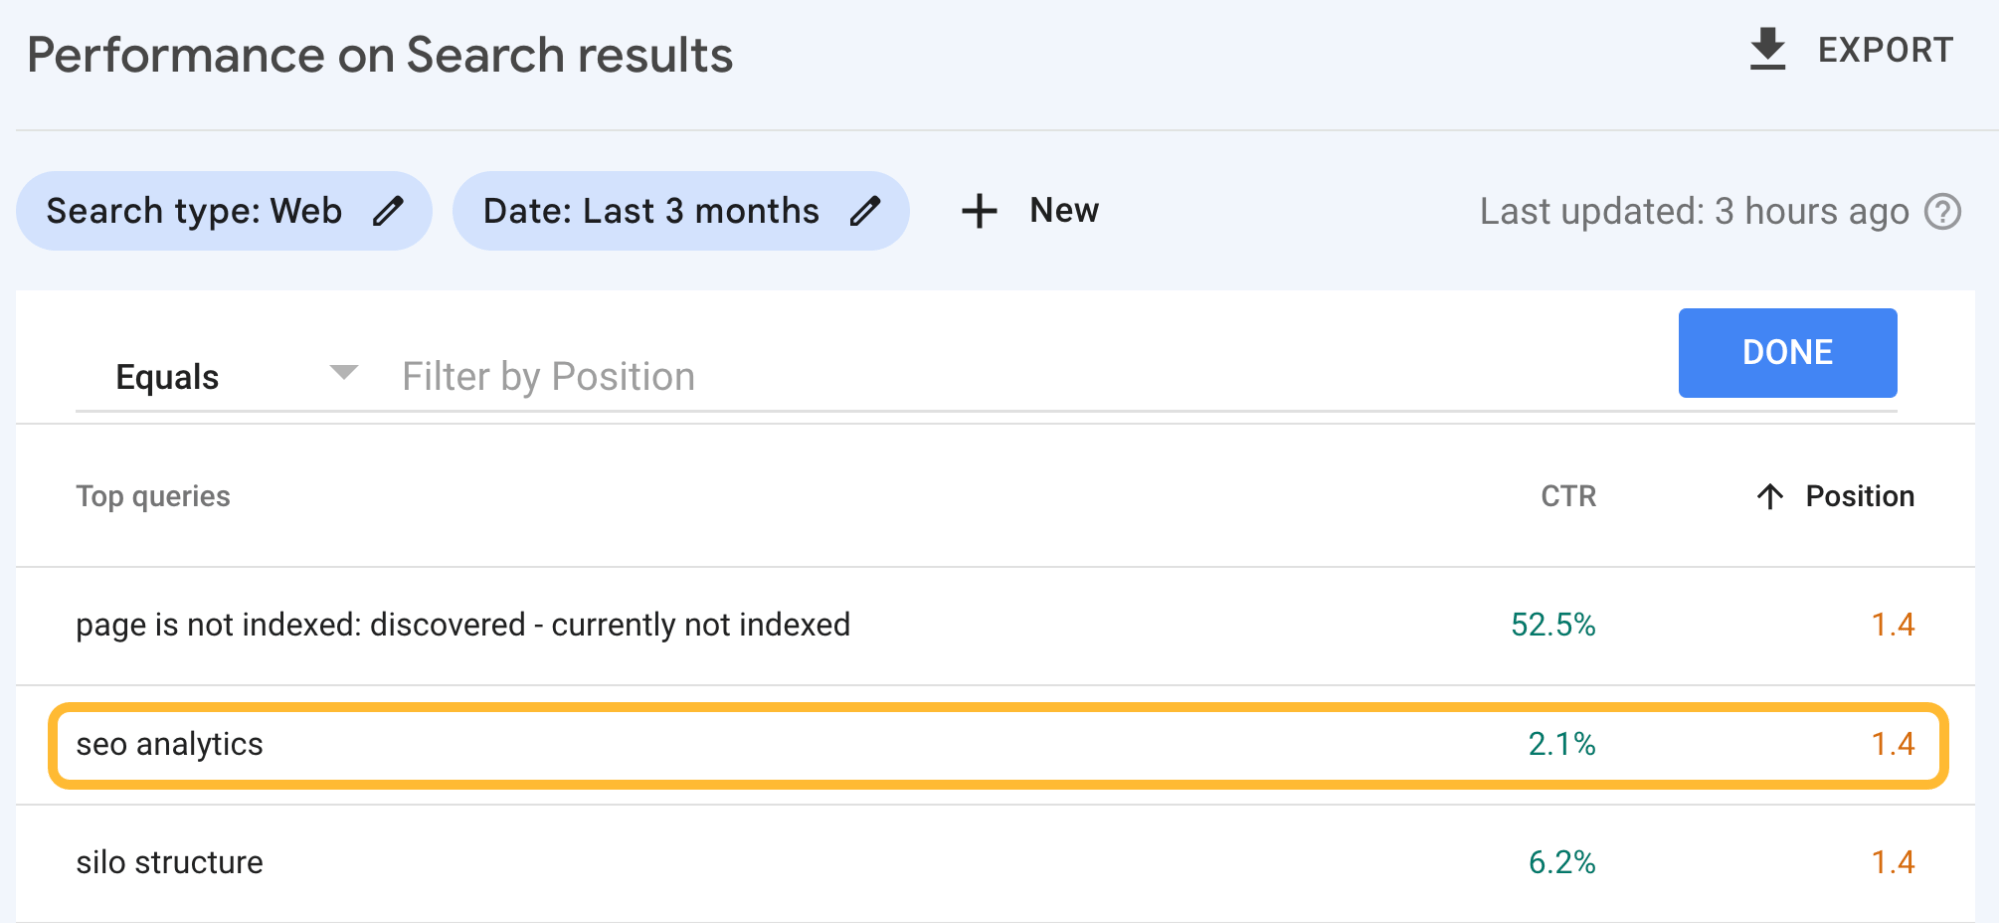
For instance, this is an interesting case. The keyword “seo analytics” has only 2.1% CTR, while it ranks at 1.4 on average. A page ranking so high should likely have more engagement on Google SERPs, so the title of that post (and perhaps the description, too) could be something to improve on.
Pricing
Free.
FURTHER READING4. Mixpanel
Mixpanel is a product analytics tool. It’s a bit like Google Analytics but designed especially for measuring user behavior in SaaS products, mobile apps, and e-commerce platforms.
Key use cases
- See which features people interact with the most and which are barely touched. Popular features can be highlighted in campaigns, while less popular ones may need more educational materials or updating.
- Understand the impact of newly launched features on product adoption and sales.
- Study the paths users take after signing up for your product (or any other specific event) to uncover friction points or see how long it takes them to get to essential features.
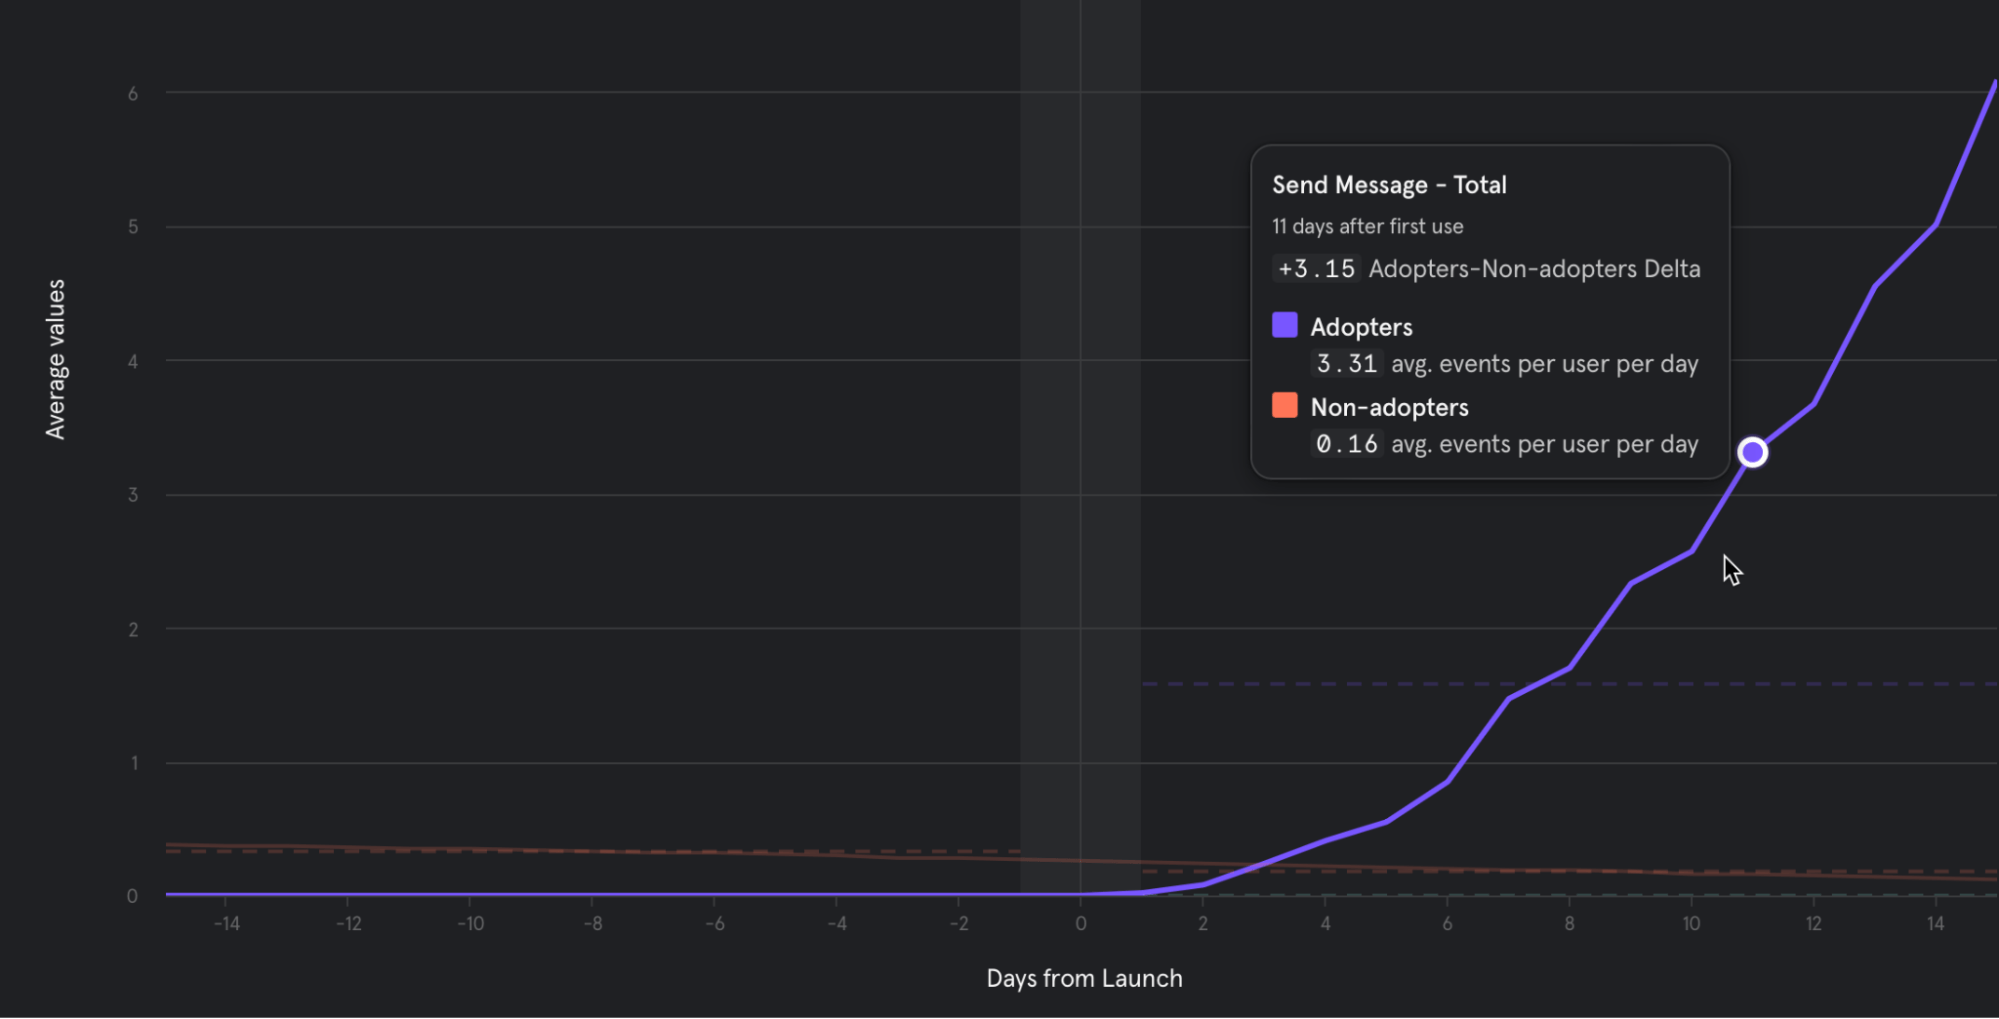
Highlighted feature: Impact report
Impact report is Mixpanel’s solution to the classic problem of measuring the results of newly launched product features.
Imagine you launched new in-app tutorials. Do they encourage users to spend more time using the app, or create more projects, or churn less frequently? Mixpanel can show you the relationship between these changes and dozens of different outcomes. Your report would look something like this:
Pricing
Free plan available. Premium plans start from $20/mo.
5. Microsoft Clarity
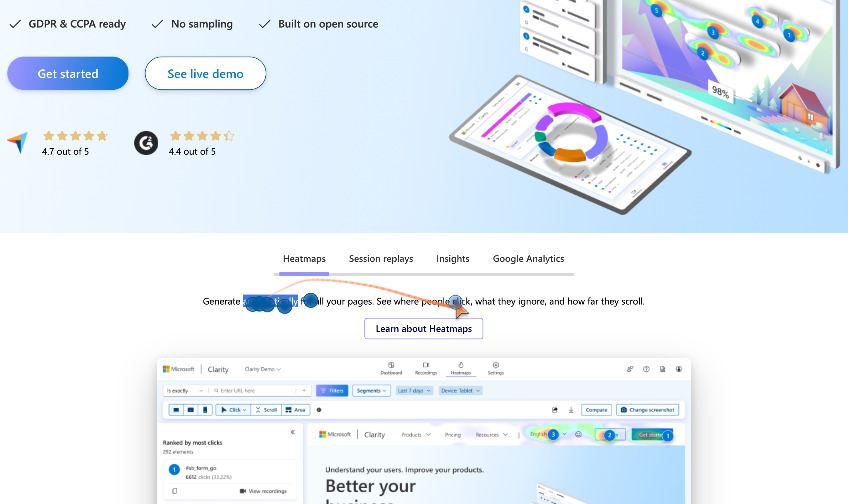
Microsoft Clarity is a behavior analytics tool that allows you to literally see how users interact with your site and spot user experience issues that can harm your performance.
You can think of it as a tool that fills the heat mapping and session recording gap in GA4. You can even integrate these two to watch recordings of user segments set up in GA4.
Key use cases
- Use heatmaps to discover user experience issues like rage clicks (rapidly clicking in an area), dead clicks (clicks with no effects), and click backs (immediately leaving a page).
- Use session recordings to pinpoint places where users might hesitate, get stuck, focus, or skip the content.
Highlighted feature: Recordings
You can use session recordings to see which parts of your pages, apps or platforms are most engaging and which make you lose clicks (and potentially money). And no worries, users remain anonymous (Microsoft Clarity is GDPR- and CCPA-compliant).
The recording feature looks like this. The thin orange line indicates cursor movement, and the blue circles mean that the user clicked.
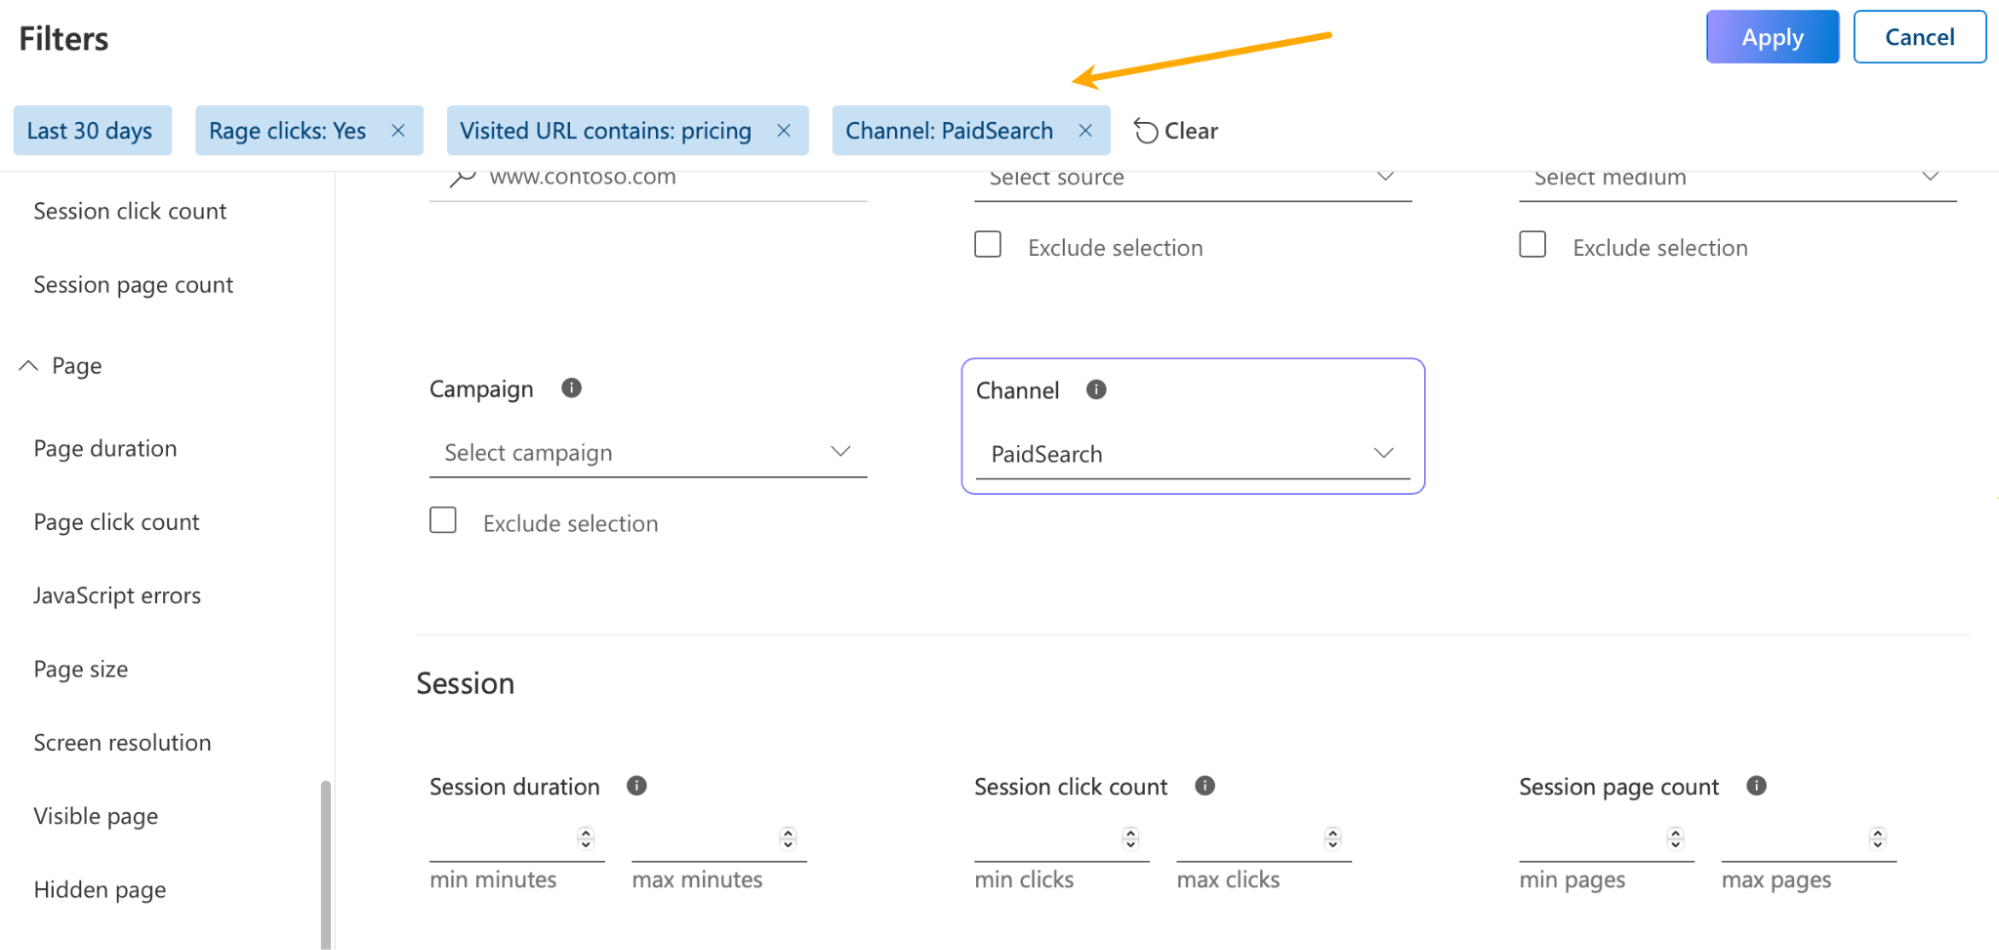
Since there’s probably no use in watching all of the recordings, you’ll find the filtering and segmenting option highly useful. For example, you can watch only the sessions with rage clicks or the ones where users viewed the pricing page and entered through Google Ads.
Pricing
Free.
6. Visual Website Optimizer
Visual Web Optimizer allows you to run experiments such as A/B testing and choose winning ideas based on data.
If you’re unfamiliar with A/B testing, it’s when you show two or more variations of a webpage to different users at the same time to determine the best one.
Key use cases
- Create variations of landing pages, forms, CTA buttons, copy, etc., to improve conversions.
- Run on-site surveys to understand what kept users from purchasing a product or signing up.
- Use form analytics on your most important forms to uncover friction points and iterate on their design.
Highlighted feature: Plan
What I really like about this tool is how it helps you to stay organized with your experiments.
Why is this a problem in the first place? Because it’s too easy to get lost in dozens of experiments and what they really mean. This feature keeps it all organized and reminds you to plan your experiments—otherwise, you’ll be shooting in the dark.
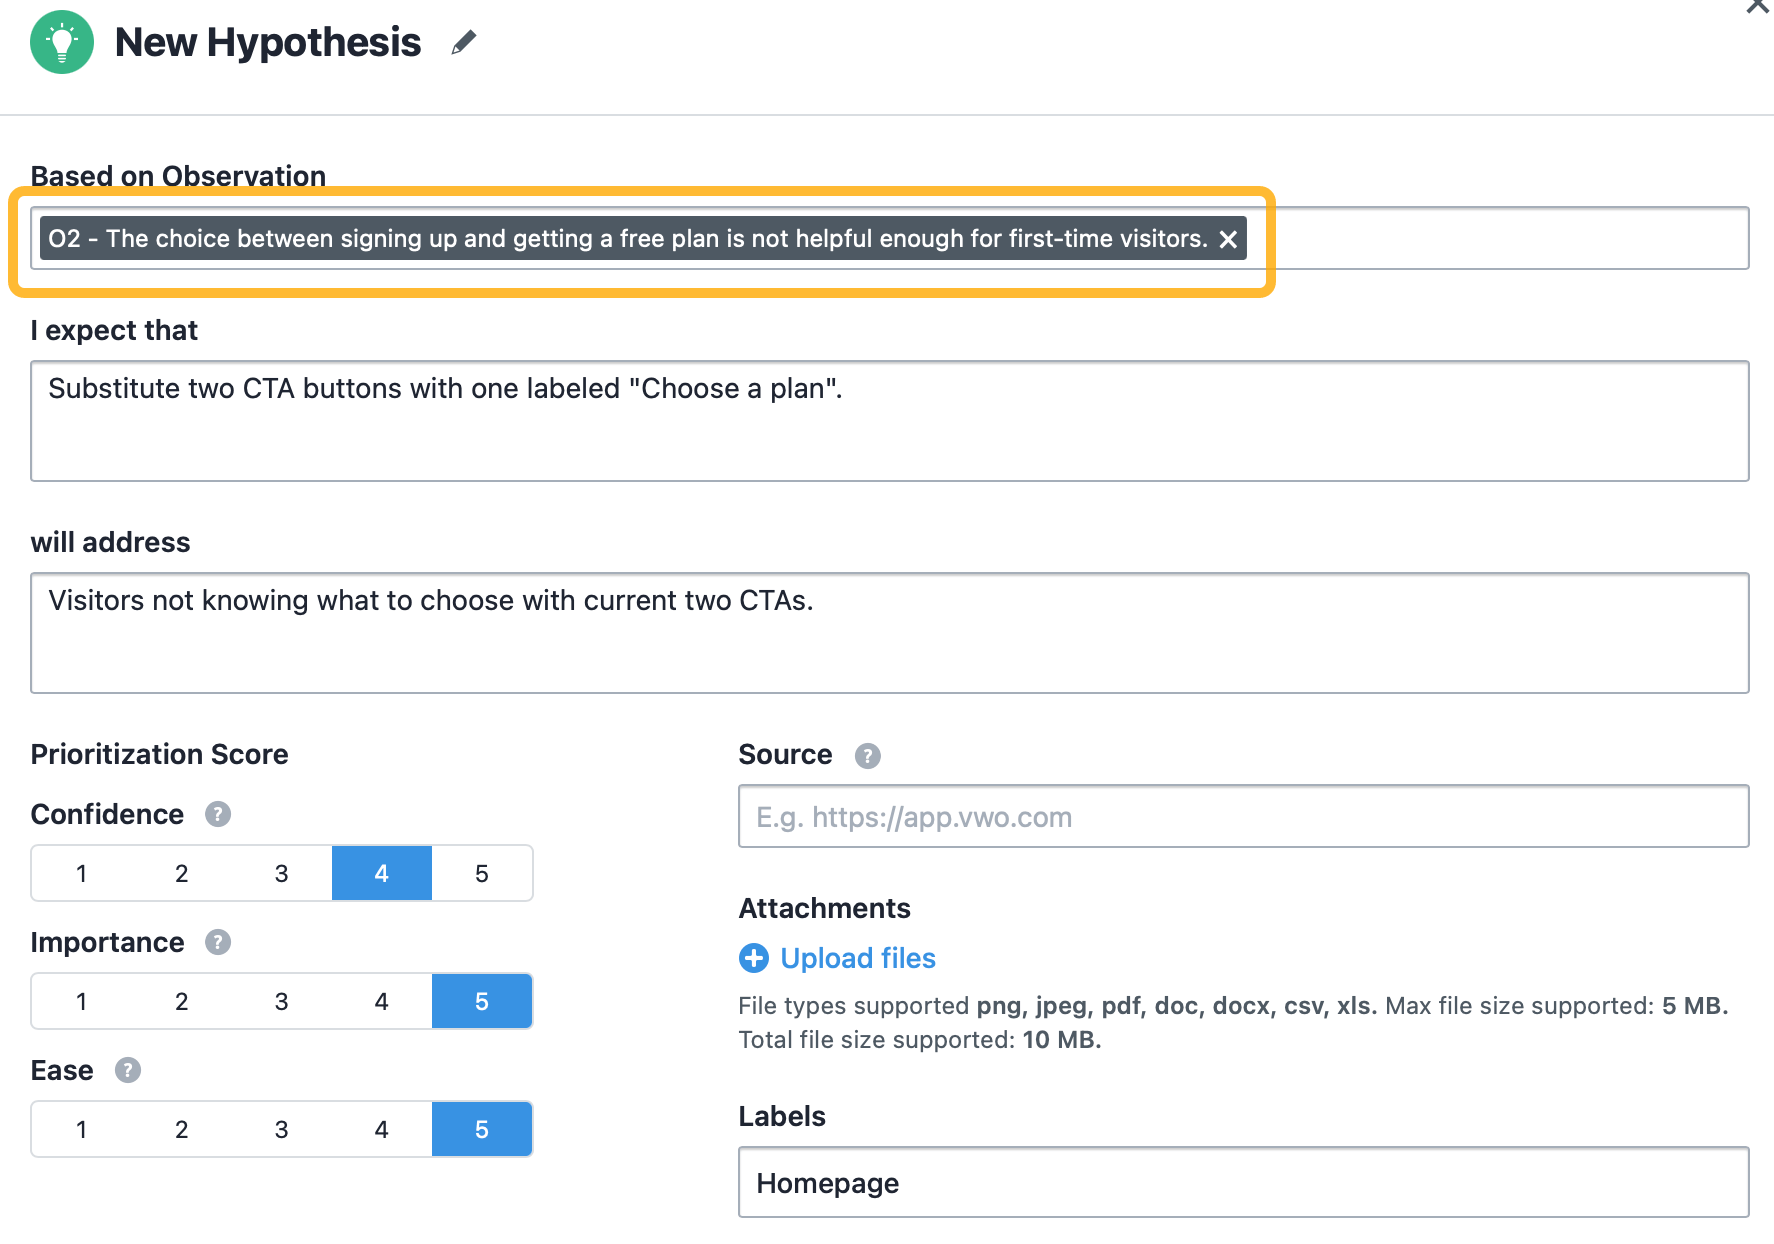
Meet the Plan feature. It allows you to:
- Plan your experiments and document what exactly you’re testing and why.
- Collaborate by assigning tests to other team members.
- Structure your work the scientific way. Note down your observations, create hypotheses when you know what to change on your site or app, and link them to different experiments when you’re ready to act.
Pricing
Free plan available. Premium plans start at $173/month for the core tool and depend on the number of users you want to track per month and optional tools.
7. Brand24
Brand24 is a media monitoring tool. Basically, it tells you what the internet thinks about you and how often it mentions your brand — and that isn’t limited to social media. It can do the same for your competitors or any other brand you want to look up.
Key use cases
- Analyze your social media performance by monitoring the reach of your campaigns and engagement with your content.
- Discover public opinion of your brand and your products by using sentiment analysis. In the short term, you can analyze people’s reactions to particular events (e.g., new features), while long-term analysis allows you to spot trends.
- Be the first to know when there’s a sudden spike in engagement. Jump in when there’s a crisis or when your campaigns start to take off.
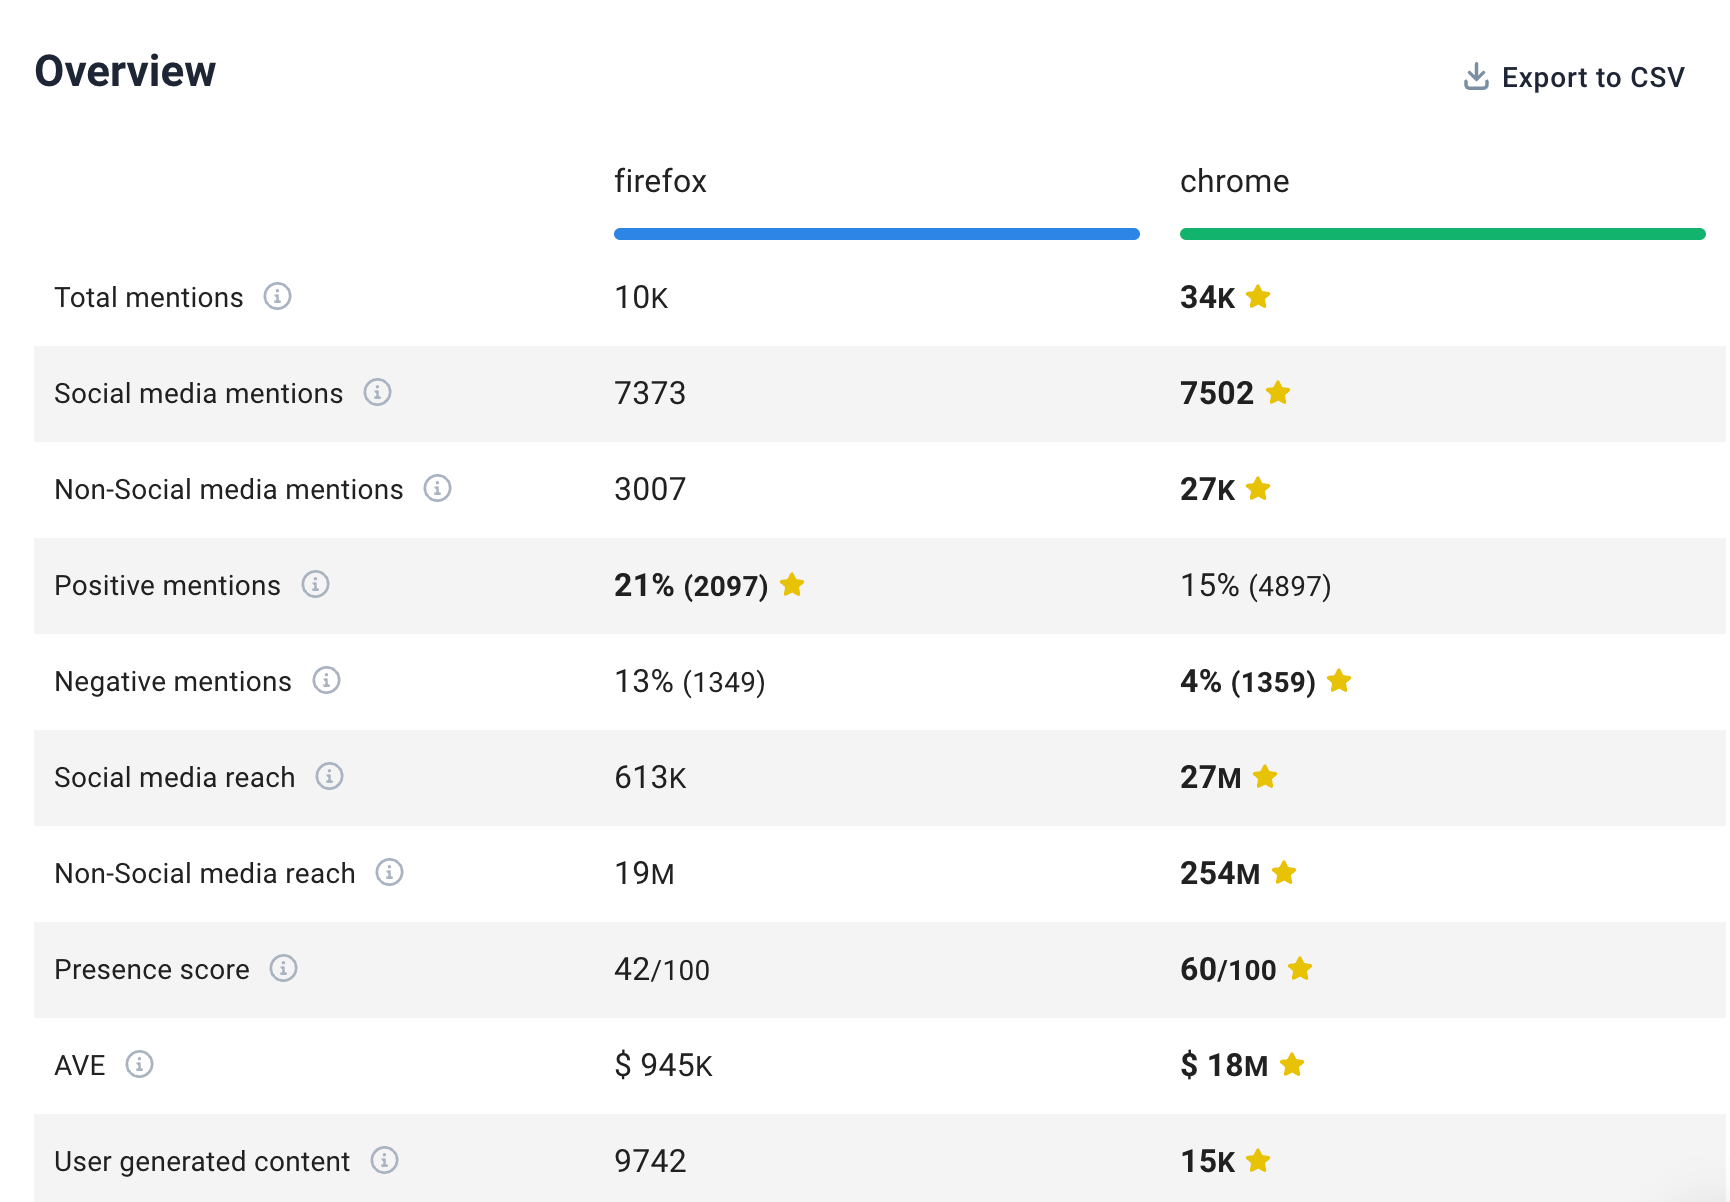
Highlighted feature: Comparison
This feature has two aspects. The first one is for competitive analysis. It lets you compare brands to see who has a wider reach on the web and who has been mentioned more often in a positive context.
This allows you to use other brands as benchmarks and track your performance against theirs.
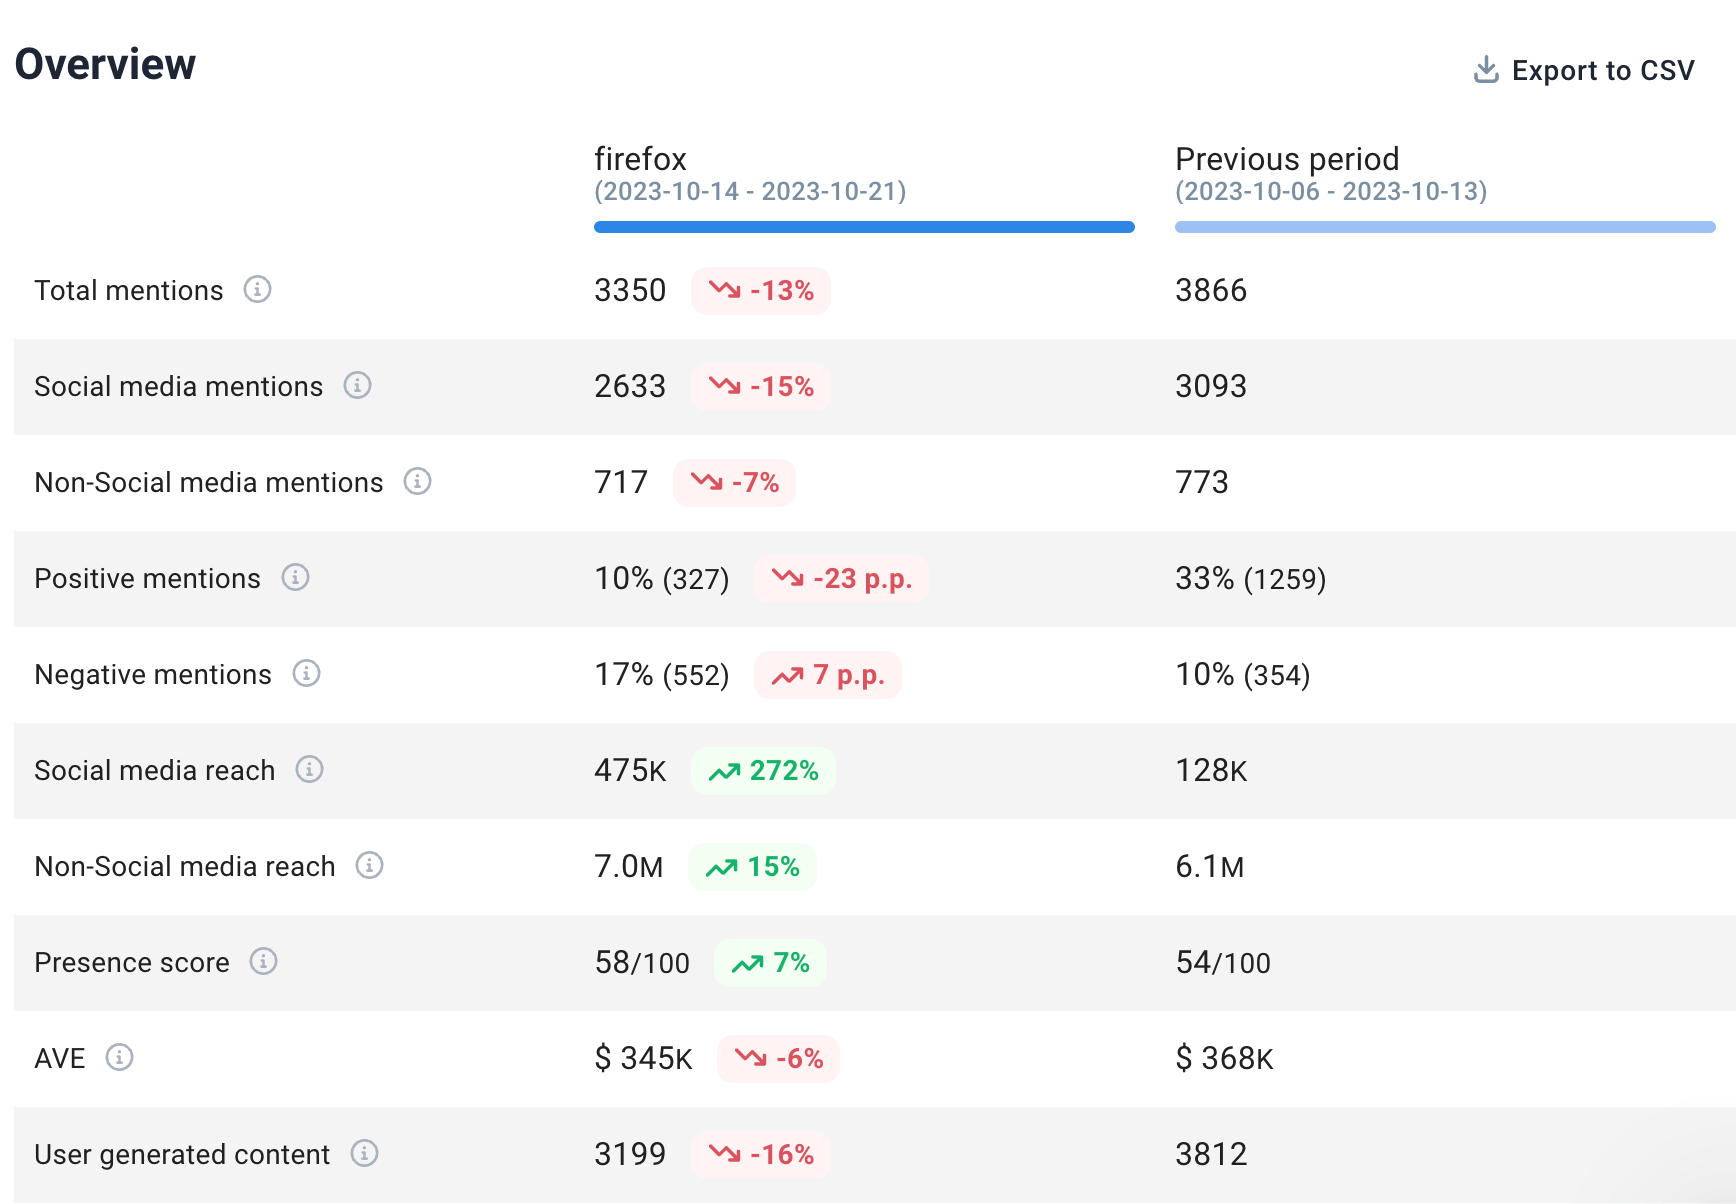
The other aspect is for comparing your performance period over period. So, for example, you can see if your efforts made you more popular on social media this quarter or see if your PR efforts changed how people feel about you.
Pricing
Premium plans start at $99 a month. You can get two months free off any plan if you pay annually.
Brand24 also offers a 14-day free trial.
8. Klipfolio
Klipfolio is a business analytics tool that allows you to gather the most important reports from other marketing analytics tools and put them on one neat dashboard that you can share online or put on a big screen in the office for everyone to see.
Key use cases
- Instead of jumping from tool to tool, you can get a glance at your most important data in one place: new leads, page views, brand mentions, goal completion rate, monthly recurring revenue (MRR), etc.
- Put data from different sources on the same chart. For example, you can see if an increase in ad spend impacts MRR.
- Share data with stakeholders who have no access to other analytics tools (or don’t know how to use them): investors, management, and other departments in the company.
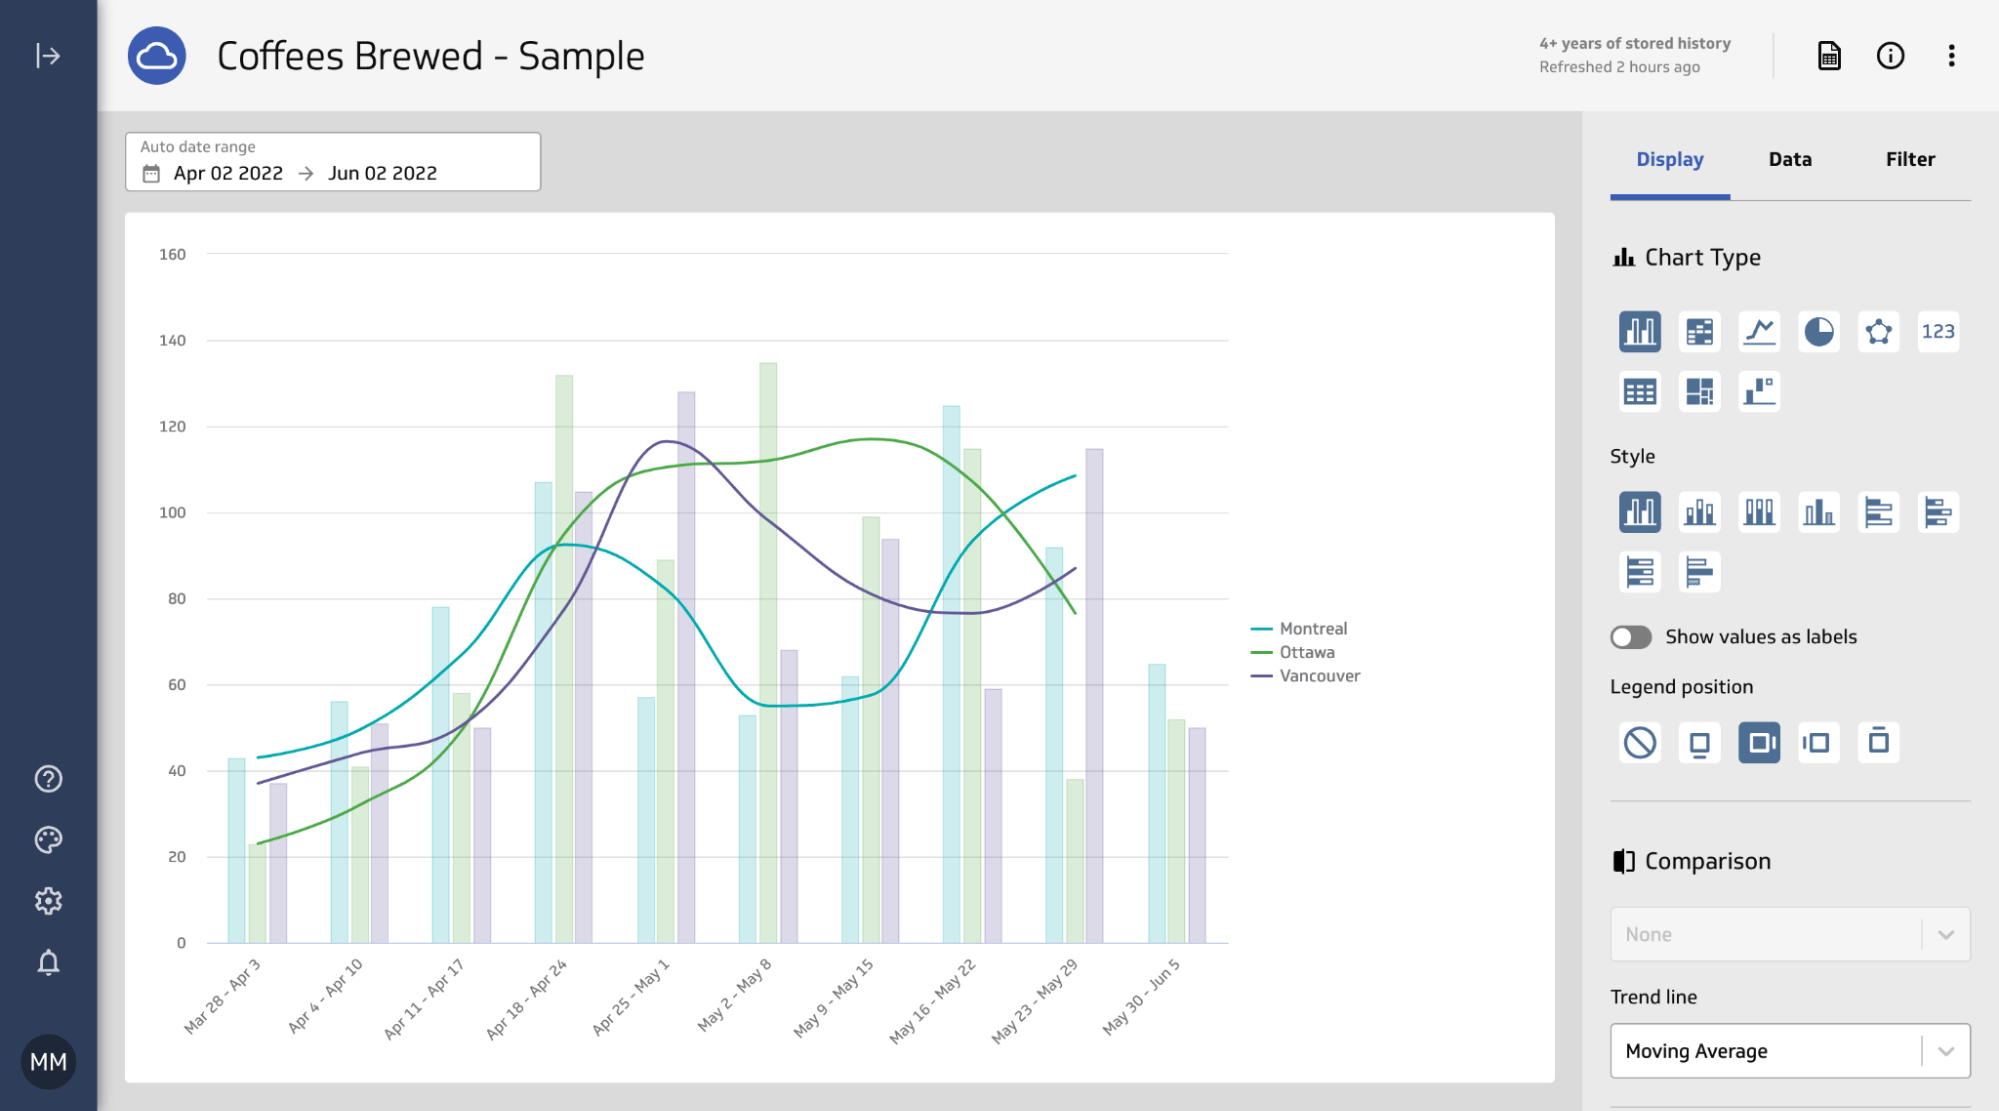
Highlighted feature: Data transformation
A cool feature of Klipfolio is that you can control how your data will be displayed once it’s been pulled into the tool.
There are different chart types and styles available. You can compare datasets right inside the tool or display a moving average over a column chart.
Pricing
Free plan available. Premium plans start from $125/mo (or $90/mo if you pay annually).
9. ProfitWell
ProfitWell Metrics (part of Paddle) is a subscription management and revenue optimization platform designed for SaaS companies and subscription-based businesses. It helps you understand your revenue metrics and improve subscription retention.
Key use cases
- Gain insights into your subscription metrics, including Monthly Recurring Revenue (MRR), Churn Rate, Average Revenue Per User (ARPU), and Customer Lifetime Value (CLTV).
- Identify inactive users across all subscription plans to prevent churn.
Highlighted Feature: Growth Rate
ProfitWell packs a few interesting features, but the one you’ll probably be using it for the most is the simplest of all — your MRR growth rate.
The tool will prepare a nice visual answer to two questions: “is the business growing?”, and “why are we losing money?”.
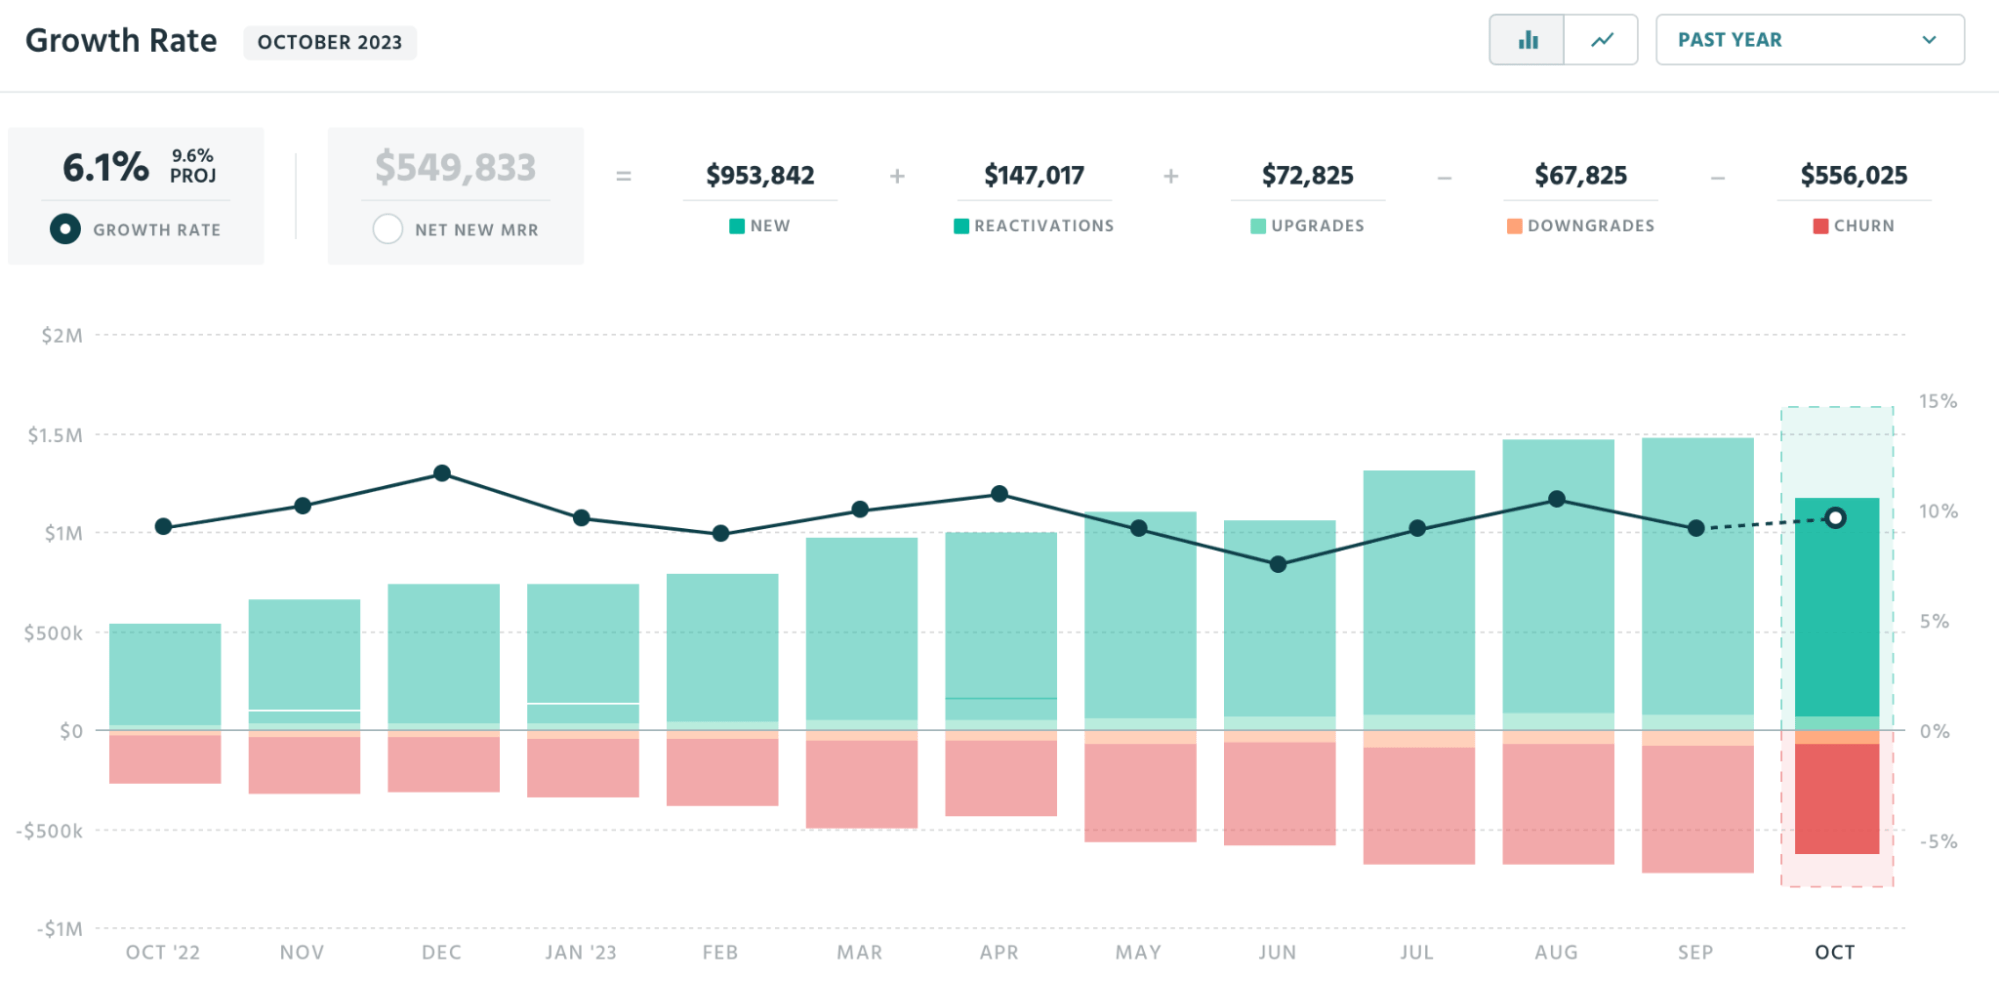
This is something you’ll definitely want to check if you want to know how your marketing tactics impact your sales. Also, this is the vital graph for determining whether your churn rate is at an acceptable level or growing.
Pricing
Free.
10. vidIQ
VidIQ is a tool for YouTube that provides analytics and optimization features for video content creators and marketers. It helps brands grow their channel, increase views, and improve video performance.
Key Use Cases
- Get ideas for new content based on keywords other channels target and your competitors’ top content.
- Double down on the content that works and find what’s not working for your channel with performance metrics such as subscribers gained/lost, views per hour, engagement rate, and card click rates.
Highlighted feature: Channel audit
This is the best place to check if you want to see what’s been working, what to fix, and what to stop doing completely in your videos.
The tool does that by ranking your videos based on eight different performance metrics, such as views per hour, engagement rate, and subscribers gained.
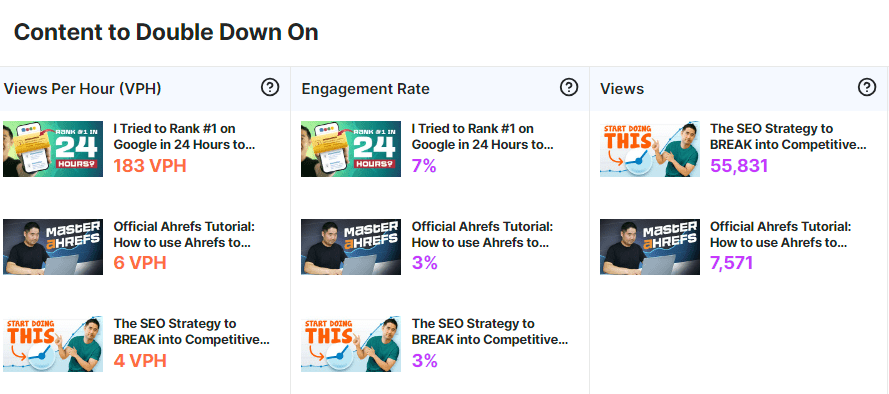
So let’s say you’ve been trying that new, experimental type of video lately, and you’re not sure your audience will still find them relevant. A good answer to that would be the “subscribers gained/lost metric”. If you’re aggressively losing subscribers on those new videos, that new content may not be working for you.
Pricing
Get started for free, with plans ranging up to $99/mo for advanced features and coaching sessions.
11. HubSpot
HubSpot is like a Swiss Army knife for handling marketing, sales, and support all in one spot. While it isn’t exclusively an analytics tool, its distinctive advantage is its ability to unify these customer-centric teams, allowing them to collaborate.
Key use cases
- Bring multiple marketing operations (e.g., lead generation, email marketing) under one roof for easier management and seamless data.
- Create dashboards to connect the dots between different marketing channels and campaigns.
Highlighted feature: Dashboards
Dashboards are essential for marketers who use multiple channels, providing a quick overview of their performance. I’m sure you’ve seen a dashboard before, but here’s how they look in Hubspot.
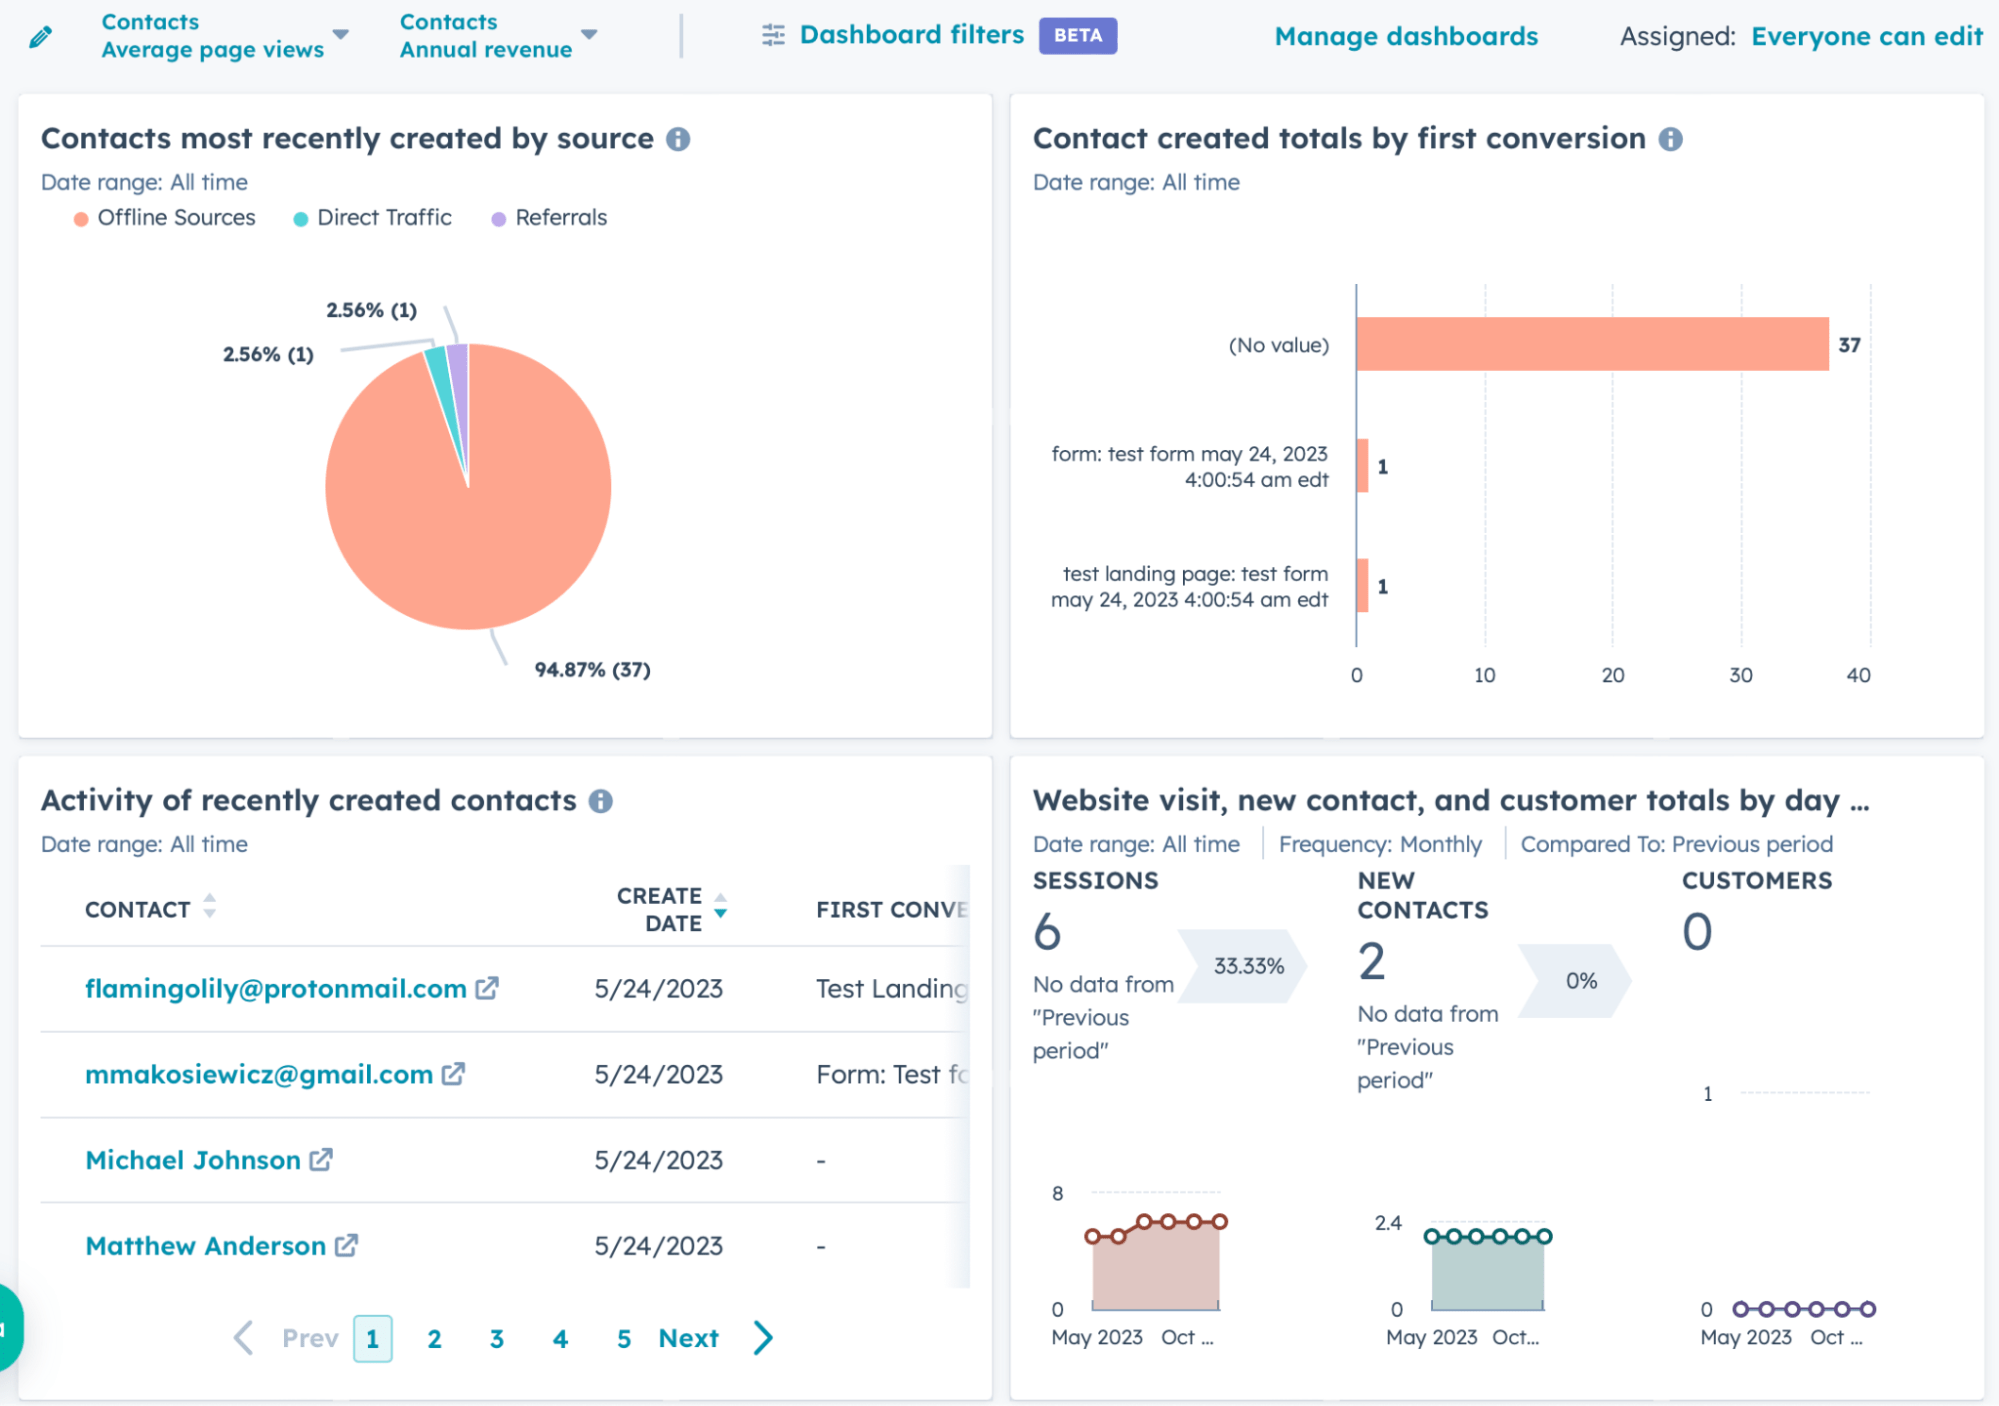
For example, you can easily create a dashboard of your quarterly performance that combines KPIs for your blog, email campaigns, and lead generation.
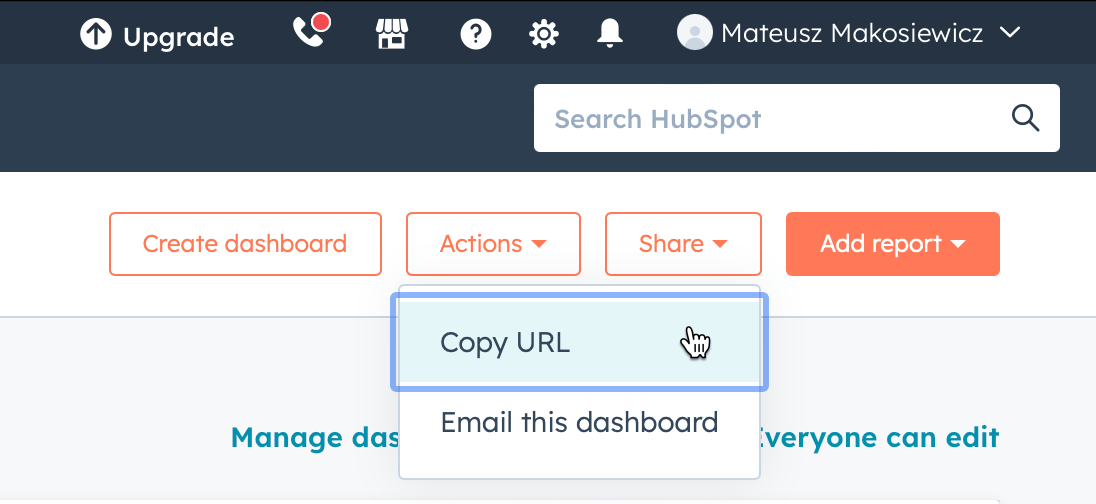
Marketing teams will enjoy the collaboration part of this feature. Any team member can create their own dashboards and just send a link to it or email it, instead of making dozens of screenshots.
Pricing
HubSpot’s free plan allows for up to 3 dashboards, with 10 reports per dashboard. More dashboards will require one of their premium plans.
12. ChatGPT
Obviously, ChatGPT is very different from all other tools on the list. It doesn’t collect any data from your site or products, and it doesn’t create nice visual reports you can access anytime.
However, there are different types of analysis. What we’ve covered so far are tools for descriptive analysis — the what-happened analysis.
For that to be useful, you still need to answer questions like why that happened, what you should do next, and what could happen if you take a certain action.
Could ChatGPT help with all that? Let’s ask it.

And it said:
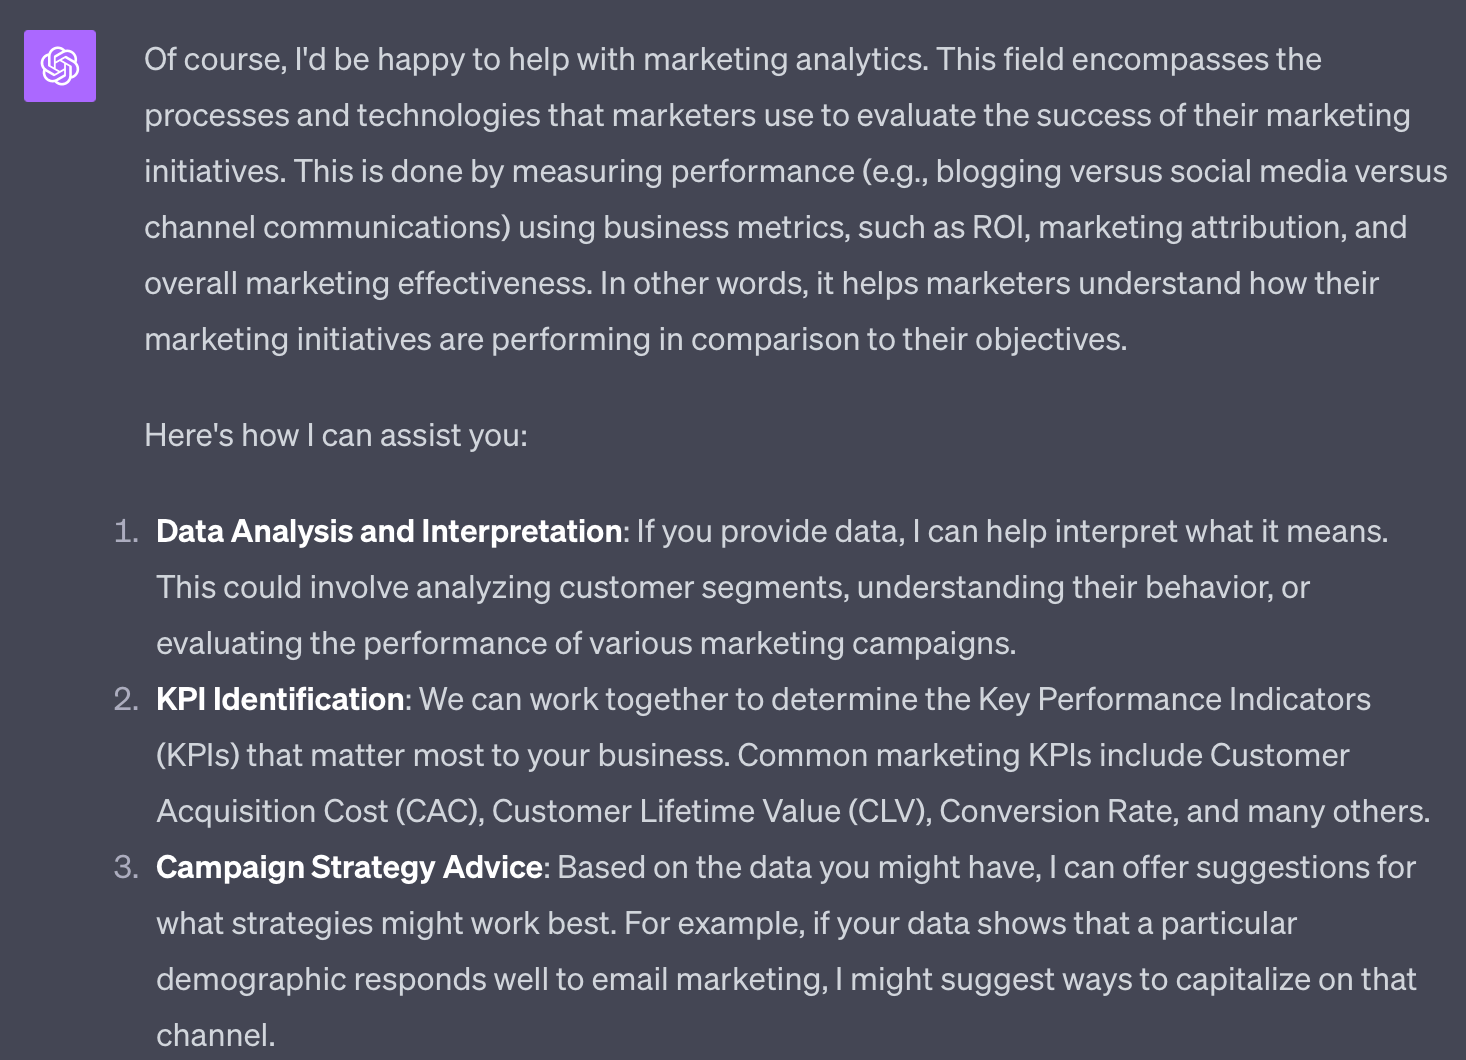
So it looks like ChatGPT 4 is quite confident about its skills. All in all, I got 10 surprisingly convincing use cases. Here are some interesting ones.
- I can provide explanations and guidance on various analytics.
- I can guide you on setting up reports that make sense for your business.
- We can discuss how you might use predictive analytics in your marketing efforts, using historical data to predict future outcomes.
- By analyzing customer data, you can gain insights into customer behavior, preferences, and trends that can drive marketing strategy.
Highlighted feature: Understanding data and looking for solutions
Let’s give ChatGPT a specific problem and see what it spits back. Now that the tool supports image-based prompts, this should be quite interesting.
So here’s my question; it’s based on an SEO problem I was actually working on. To make things harder for AI, I have given absolutely no thought to the prompt, pretending to be a total beginner in both ChatGPT and my analytics tool (Ahrefs).
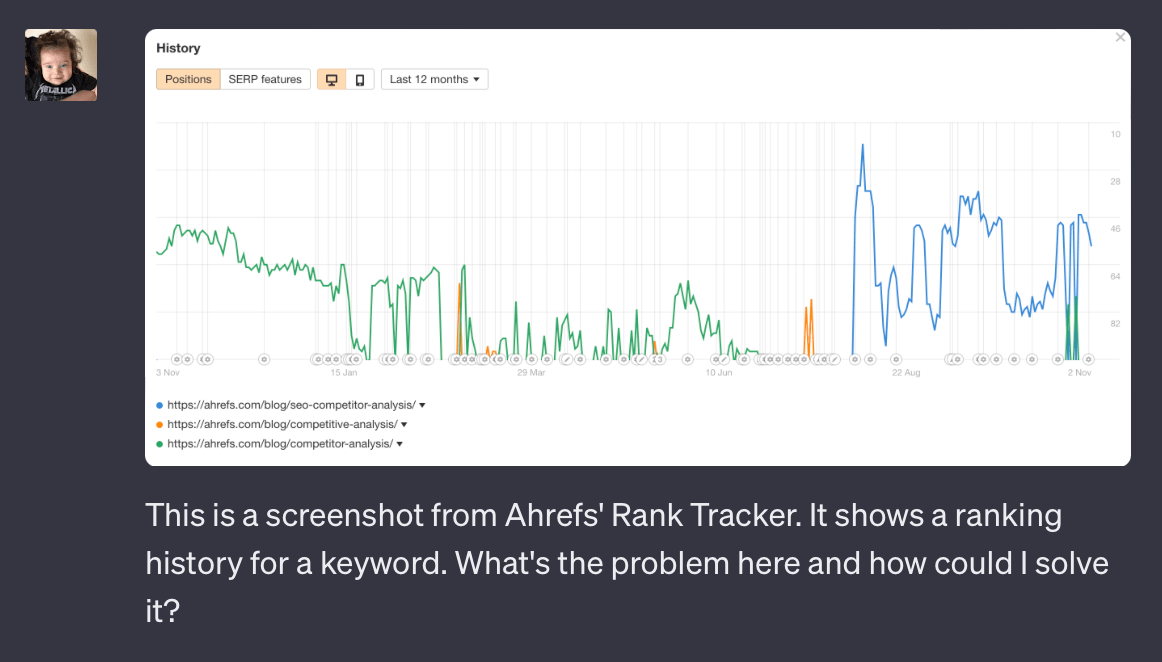
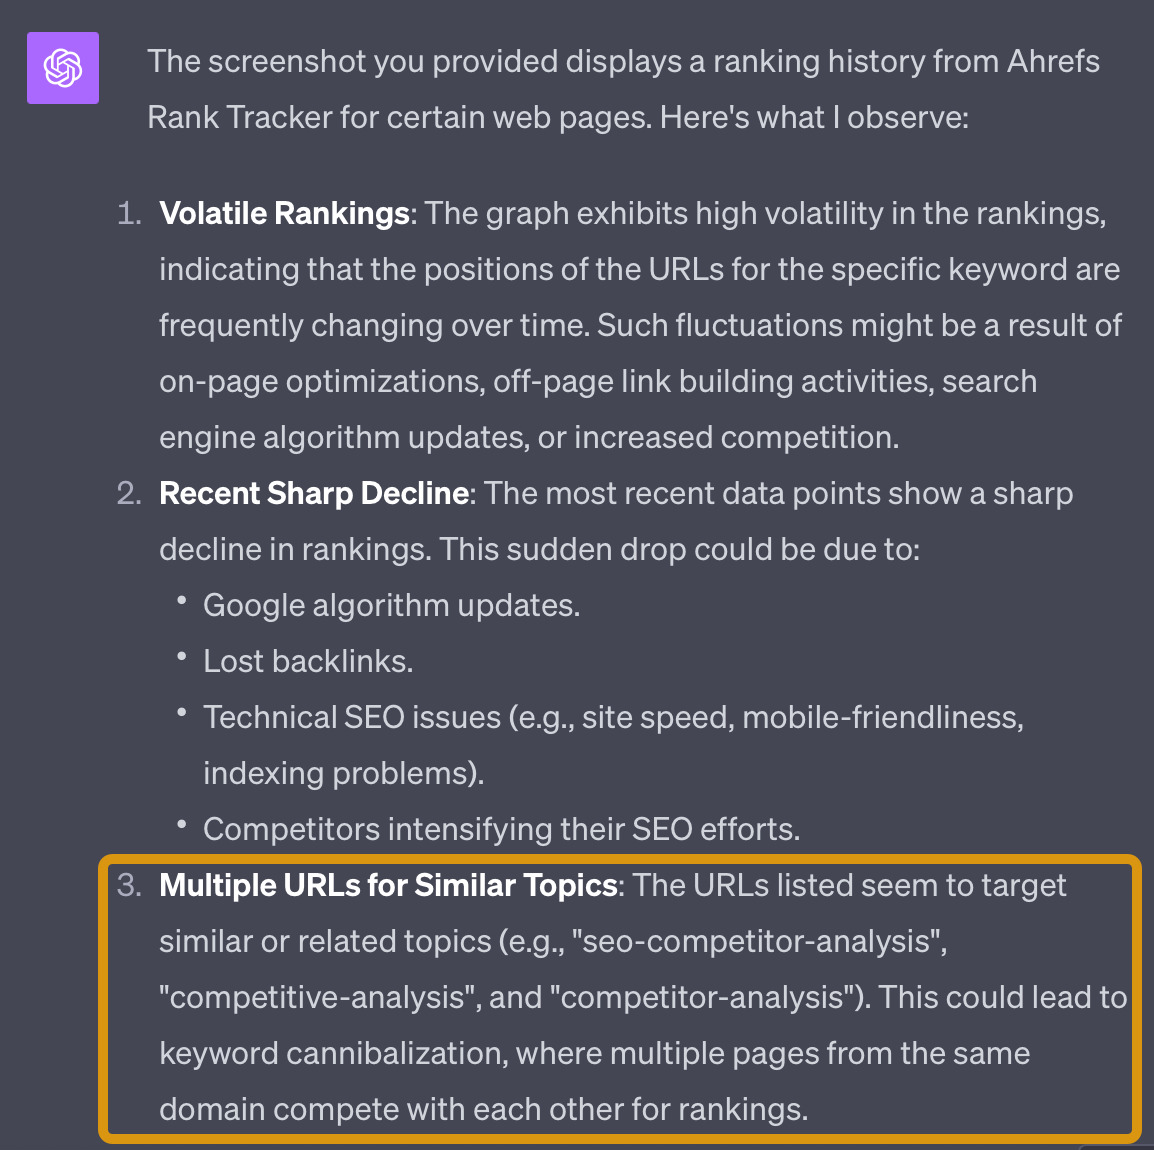
And here’s the answer. I have to admit, I was blown away. That highlighted part is a correct analysis of the problem and exactly the thing I was trying to fix.
I also got a decent hint on how to solve it:
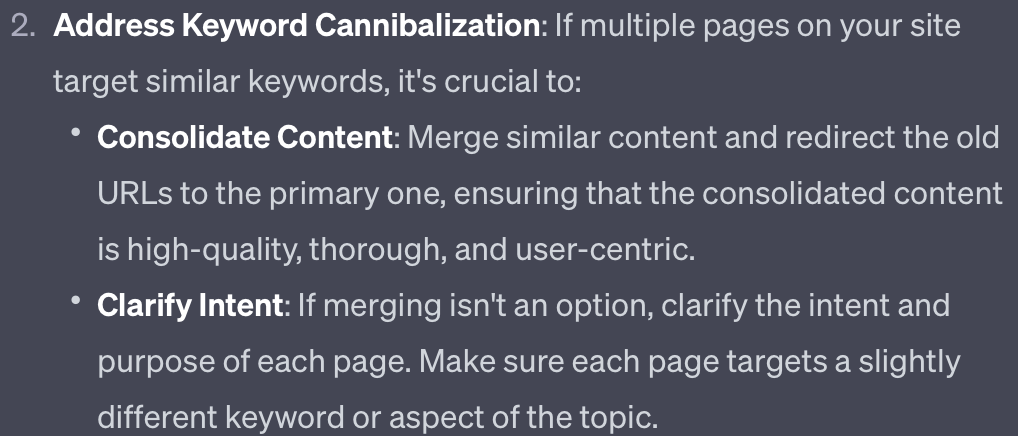
So there you have it. If your analytics tools give you data you’re not sure what to do about, ask ChatGPT. At the very least, it will provide a good starting point.
Pricing
ChatGPT Plus plan costs $20 a month, and ChatGPT API costs $0.002 per 1000 tokens. You’d need the API to use the tool’s functionality in other apps, for example, crunch data in Google Docs.
Free plan available.
Final thoughts
For this article, I’ve picked the tools that I like, have experience with, and could easily recommend to my best friend. I hope this helps you make the choice!
Find me on X.

Article by
Mateusz Makosiewicz
Marketing researcher and educator at Ahrefs. Mateusz has over 10 years of experience in marketing gained in agencies, SaaS and hardware businesses. When not writing, he's composing music or enjoying long walks.